PwC Switzerland Power BI virtual case simulation:
In the age of digital transformation, the business landscape is constantly evolving, presenting both challenges and opportunities. Recently, I had the privilege of embarking on a transformative journey with PwC’s Power BI virtual case simulation, delving deep into the world of data analysis and visualization. This immersive experience not only honed my technical skills but also instilled a profound understanding of the pivotal role that data plays in driving organizational success
Situation: The leadership team at a Call Centre client company requires transparency and insights into the complex data they have. Analysis with Excel was not yielding the desired outcome. So the team wants to utilize Business Intelligence & harness the power of data to derive insights, identify trends, and drive strategic decision-making in various departments within the company.
Tasks:
Task1: Create a dashboard in Power BI for the leadership team that reflects all relevant Key Performance Indicators (KPIs) and metrics in the dataset, giving an overview of the company performance so far.
Task2: Create a dashboard reflecting Customer retention, define proper KPIs and suggest what needs to be changed
Task3: Define relevant KPIs in hiring, promotion, performance and turnover, and create a visualisation and identify some root causes of their slow progress.
Actions:
Task 1-
- Imported and cleaned data obtained from various sources including CRM systems, call logs, and employee databases
- Calculated measures to analyze metrics such as % answered calls and resolved calls
- Designed a comprehensive dashboard in Power BI showcasing all relevant KPIs and metrics such as call volume, average call handling time, customer satisfaction scores, and agent performance metrics
Task2-
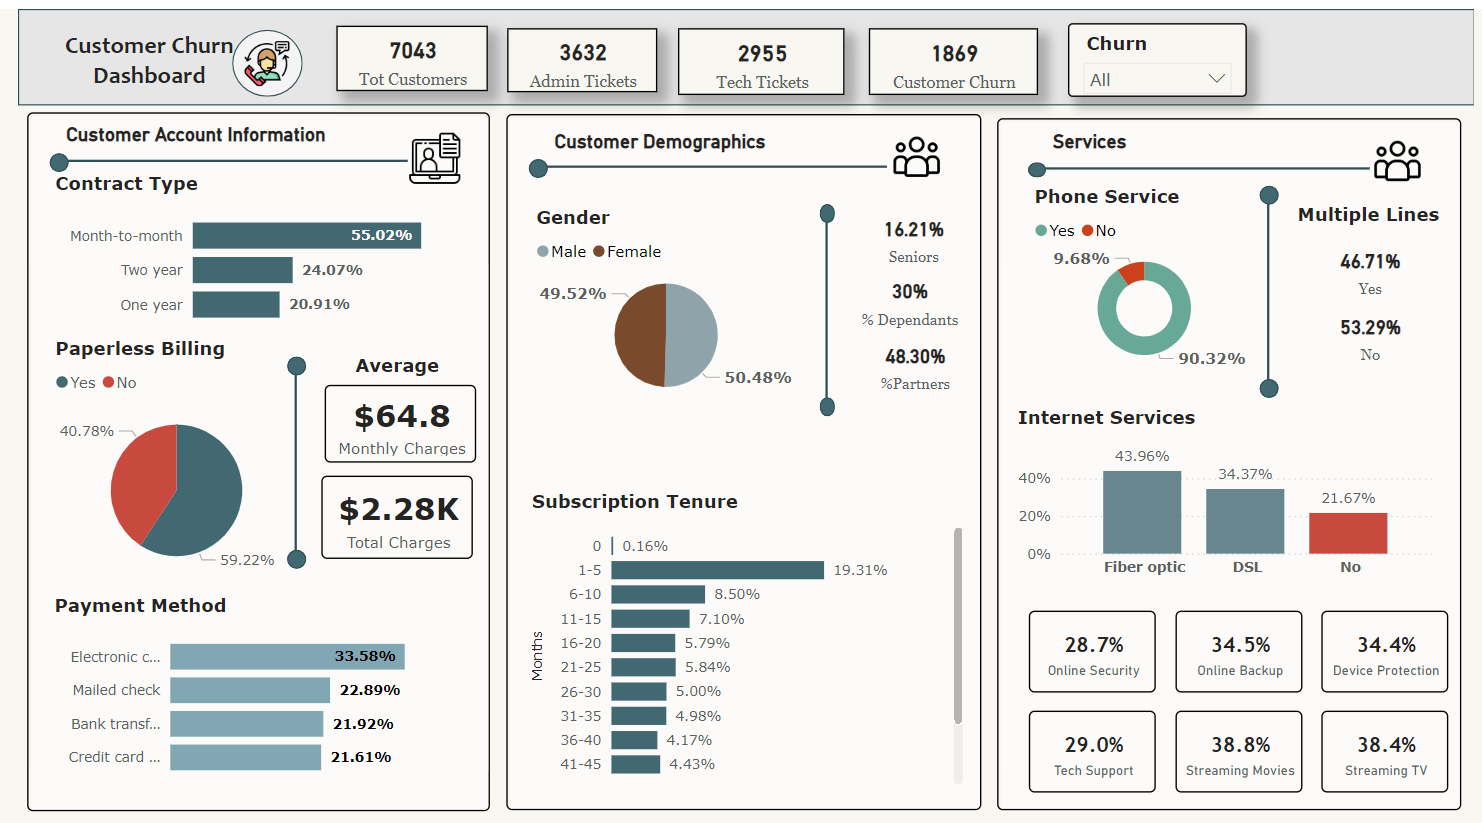
- Utilized DAX formulas, defined proper KPIs for customer retention such as churn rate, customer lifetime value, and contract type
- Designed and created various visuals including cluster charts, donut graph and stacked charts
Task3-
- Developed visualizations to track and analyze HR metrics including gender ratio, promotion rates, employee performance ratings, and turnover rates
- Deep-dived into age-wise and gender-wise employee breakup as well as promotion trends
Result:
The 3 interactive dashboards created have improved visibility into company performance, customer retention, and HR metrics leads to more informed strategic planning and resource allocation. The leadership team now has access to real-time insights and analytics through interactive dashboards, which aids in identifying areas of improvement in customer retention strategies, HR processes, and operational efficiency, which inturn leads to targeted initiatives aimed at addressing these challenges. It also facilitates increased collaboration and alignment between different departments through the shared use of a centralized BI platform, fostering a culture of data-driven decision-making within the organization.
Learnings:
- Data cleanliness and accuracy are critical for meaningful analysis and insights generation
- Continuous feedback and iteration are necessary to refine dashboards and ensure they remain relevant and actionable over time
- Utilizing advanced analytics techniques can uncover hidden patterns and insights that drive more impactful decision-making


